

What Most SLA Reports Don’t Tell You
- BPO
- 165 Views
Service Level Agreement reports measure whether contractual service commitments were met, but they don’t reveal whether customers actually received a successful experience.
Teams can consistently hit SLA targets while customer satisfaction declines because SLA reporting focuses on speed and compliance, not resolution quality, customer effort, or long-term loyalty.
Your contact center dashboard may look flawless. Response times are within target, queue thresholds are green, and every contractual commitment has been met.
Yet customer experience (CX) can slowly deteriorate beneath the surface, creating blind spots that only become visible through metrics beyond SLA compliance.
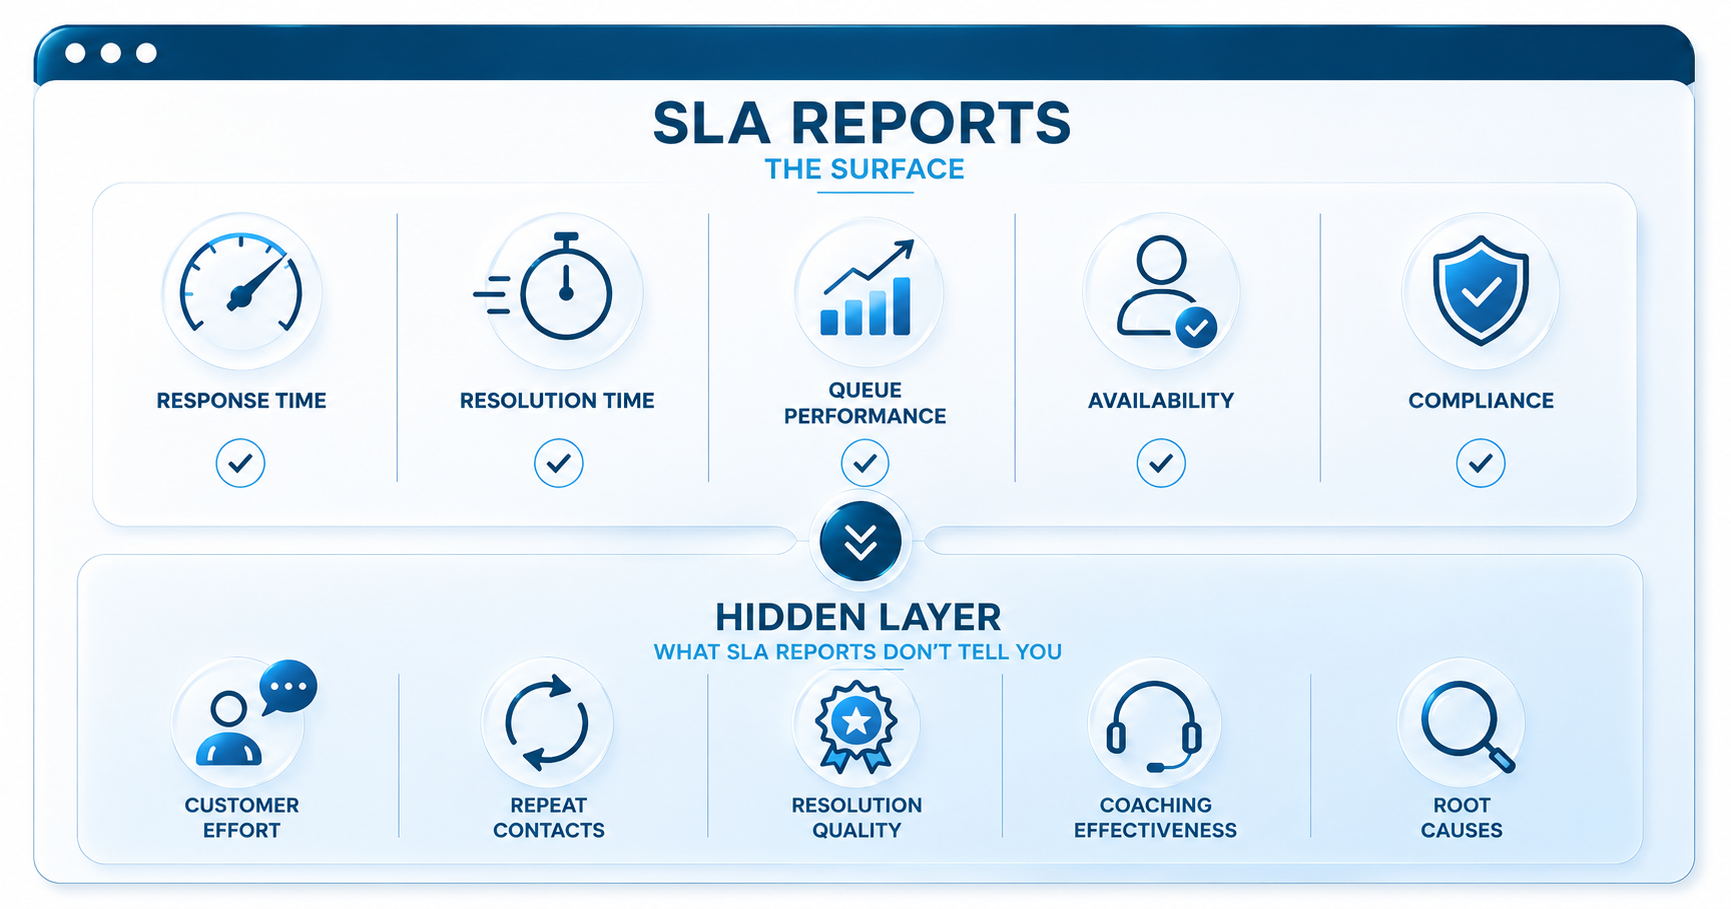
What SLA Reports Are Designed to Measure
SLA metrics exist for good reason. They create accountability, set expectations, and provide contractual baselines for performance tracking.
A typical Service Level Agreement report covers response time, resolution time, agent availability, queue performance, and compliance against contractual commitments.
These are foundational contact center KPIs, and they are important. The issue arises when leadership treats SLA compliance as the full picture rather than the starting point.
What SLA Reports Often Miss
| SLA Reports Measure | They Rarely Reveal |
| Response times | Resolution quality |
| Queue performance | Customer effort |
| Availability | Repeat contacts |
| Compliance | Coaching effectiveness |
| Speed | Root causes |
When executive teams rely solely on SLA dashboards, important performance issues can go unnoticed until they begin affecting customer outcomes.
A repeat caller who contacts support three times in a week generates three compliant interactions and one deeply frustrated customer.
Because SLA dashboards rarely capture the complexity behind an interaction, operational barriers often remain invisible.
According to Deloitte Digital’s 2024 Global Contact Center Survey, more than 600 contact center leaders reported that agents are overwhelmed by too many systems during calls, leading to longer interactions and poorer outcomes. SLA metrics rarely surface this.
The Metrics That Complete the Picture
Customer Satisfaction Score (CSAT) reveals how customers feel about the support they received, not whether the interaction met a time-based threshold. A compliant interaction and a satisfying one can be very different things.
First Contact Resolution (FCR) measures whether the issue was resolved on the first attempt.
Gartner identifies FCR as a critical indicator of customer satisfaction and customer effort because customers judge ‘first contact’ across their entire journey, not just a single support interaction.
Quality Assurance (QA) scores assess the substance of each interaction—tone, accuracy, and whether the agent resolved the actual problem.
Average Handle Time (AHT) is one of the most commonly tracked customer support metrics, but optimizing it alone often backfires. Agents pressured to shorten calls may rush through complex issues, leading to repeat contacts that inflate costs downstream.
Escalation patterns reveal how often front-line agents cannot resolve issues independently. Rising escalations despite stable SLAs suggest knowledge gaps or agent-coaching deficiencies that time-based metrics will never flag.
Customer Effort Score (CES) measures how much effort customers expend to resolve their issue. Low-effort experiences drive retention, while high-effort ones accelerate churn regardless of response speed.
Net Promoter Score (NPS) measures long-term loyalty. A contact center can meet every SLA commitment and still generate low NPS if the experience feels impersonal or unresolved.
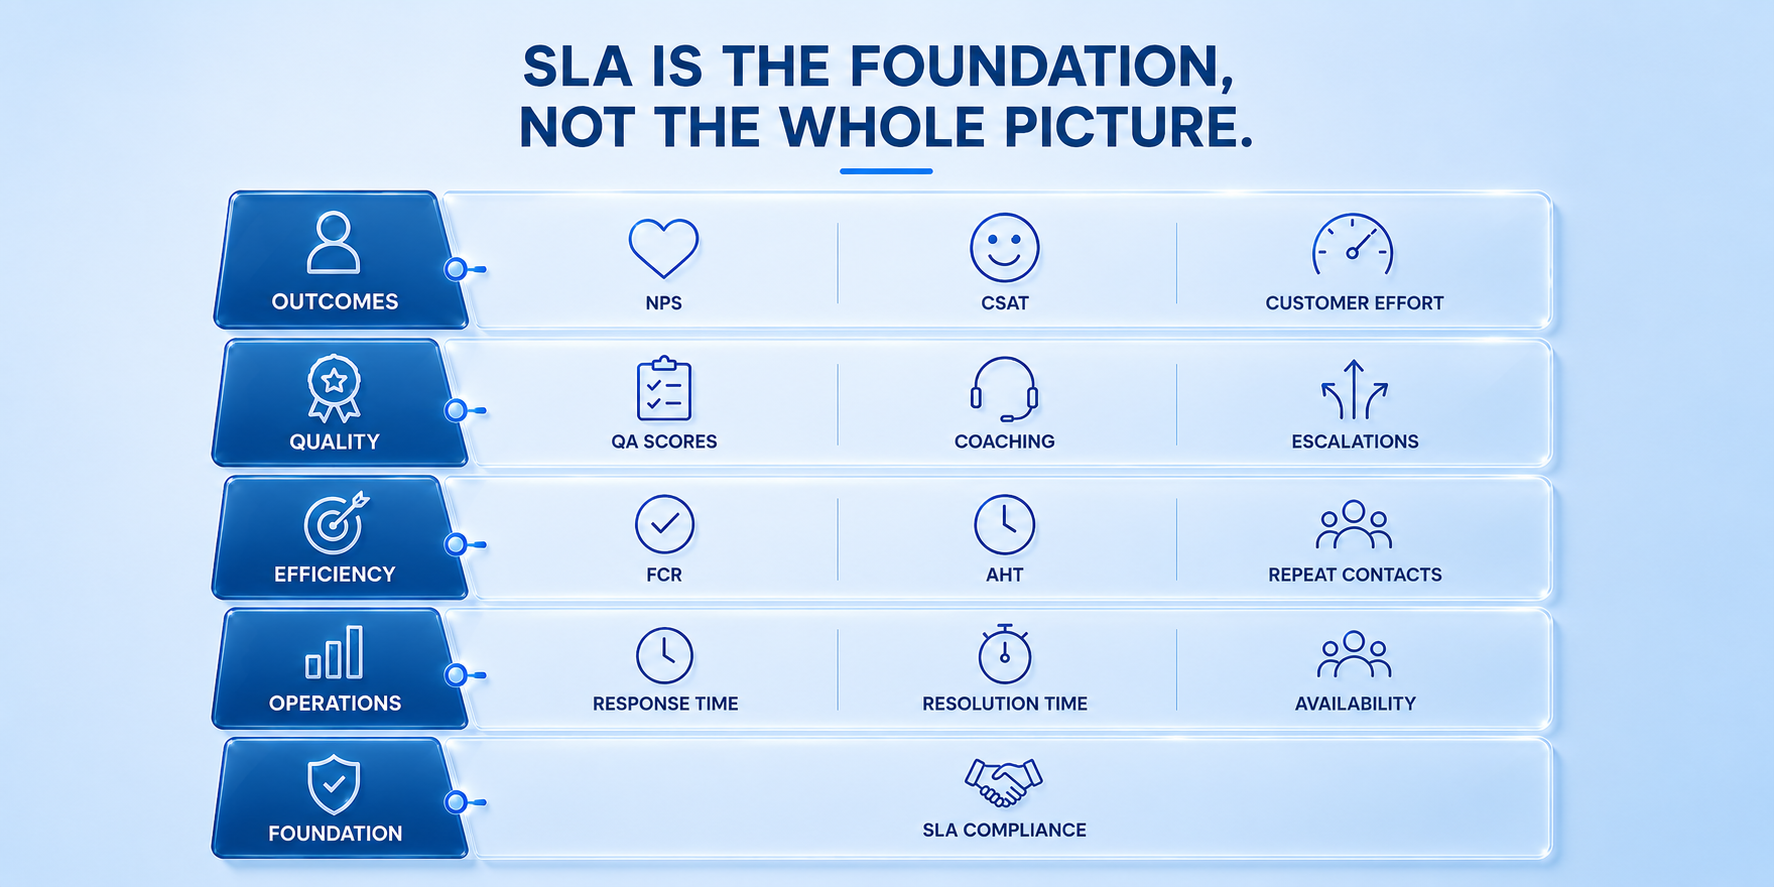
Why Good SLA Performance Can Hide Poor Customer Experience
Good SLA performance can hide poor customer experience because Service Level Agreements measure compliance with contractual targets, not the quality of the customer outcome.
Teams can consistently meet response and resolution goals while repeat contacts, escalations, and dissatisfaction continue to rise.
Consider a support team that responds to every ticket within two hours and closes every case within 24 hours. The dashboard will be spotless, but 30% of tickets will be reopened within a week, the escalation rate will climb, and the Customer Satisfaction Score will drop for three consecutive quarters.
These gaps often appear when operational metrics are optimized independently. Pressure to reduce ticket resolution time, workforce management decisions that prioritize availability over expertise, or disconnected Customer Relationship Management (CRM) systems can all contribute to repeat contacts without affecting SLA compliance.
The business impact extends well beyond customer satisfaction too. Forrester’s 2024 US CX Index found that customer-obsessed organizations reported 41% faster revenue growth and 51% better retention, yet only 3% of companies achieved that standard.
What Executive Teams Should Review Together
| Instead of Reviewing | Review Together |
| SLA | SLA + CSAT |
| AHT | AHT + FCR |
| Response Time | Ticket Resolution Time |
| Ticket Volume | Repeat Contact Rate |
| QA | Escalation Rate Trends |
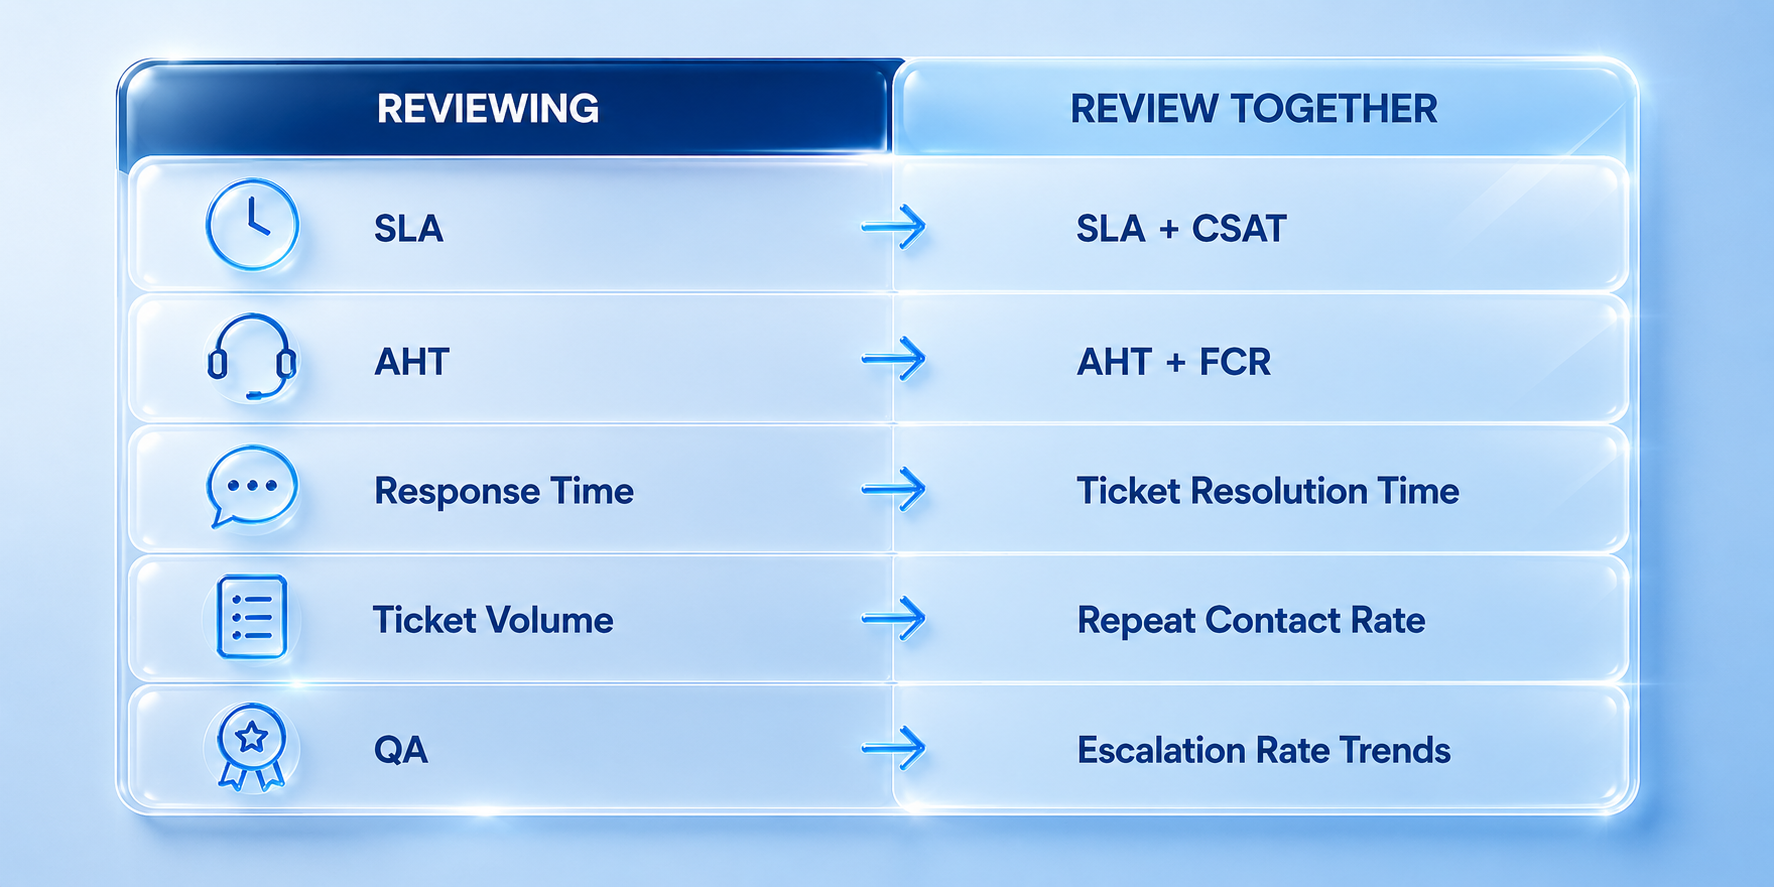
Balanced scorecards create stronger operational performance by connecting speed metrics to outcome metrics.
When contact center reporting pairs SLA data with experience and quality indicators—supported by business intelligence platforms that unify these views—leadership can identify whether efficiency gains are translating into genuine customer outcomes.
McKinsey’s research on experience-led growth directly supports this approach: strategies that improve customer satisfaction by at least 20% deliver 15–25% increases in cross-sell rates and 20–30% improvements in customer engagement.
Questions Every Operations Leader Should Ask
- Are customers contacting support more than once for the same issue?
- Are QA scores improving alongside SLA performance?
- What are the top three causes of escalations, and are they being addressed through root cause analysis?
- Are SLA improvements reflected in CSAT trends?
- Which contact center KPIs predict customer retention, and which simply record activity?
- Are reports identifying patterns for continuous improvement, or are they documenting what already happened?
Common Reporting Mistakes
The most frequent reporting mistake in customer support is treating speed as a synonym for quality. A fast response that does not resolve the problem has saved time for precisely no one—except, arguably, the dashboard.
Reviewing metrics without supporting context is equally damaging. AHT without First Contact Resolution context encourages agents to rush. SLA compliance without CSAT correlation gives leadership confidence without substance.
Ignoring qualitative feedback is another common trap. Customer comments, omnichannel support interaction patterns, and agent-reported barriers provide context that quantitative metrics cannot.
Organizations committed to operational excellence build feedback loops between agent coaching programs and contact center reporting to ensure that data drives action.
Frequently Asked Questions About SLA Reporting
What is the difference between SLA compliance and customer satisfaction?
SLA compliance confirms that service was delivered within contractual thresholds. Customer satisfaction measures whether the issue was actually resolved and how the customer felt about the experience. Both are important, but they answer different questions.
Can SLA compliance be high while customer experience is poor?
Yes. A team can meet every SLA target while customers experience repeat contacts, unresolved issues, and rising frustration.
How often should support performance reports be reviewed?
Weekly operational reviews and monthly strategic reviews strike the right balance. Quarterly reviews alone leave too much time for negative trends to go unnoticed.
Which metrics should accompany SLA reporting?
CSAT, FCR, QA scores, CES, NPS, repeat contact rate, and escalation trends should all sit alongside SLA reporting in any comprehensive performance review.
How can I determine if my SLA reporting is truly comprehensive?
A comprehensive SLA report combines compliance metrics with customer outcome metrics. Review SLA performance alongside CSAT, FCR, QA, CES, NPS, escalation trends, and repeat contacts to understand both operational efficiency and customer experience.
Why do many SLA reports focus on metrics that don’t reflect business value?
SLA reports are designed to measure contractual commitments such as response times and availability. Business value comes from combining those metrics with indicators like customer satisfaction, loyalty, and issue resolution.
Why are operational metrics often prioritized over customer outcome metrics in SLA reports?
Operational metrics are easier to define, standardize, and measure consistently. Customer outcome metrics provide additional context, helping organizations understand whether meeting SLA targets also delivers a better customer experience.
Turning SLA Data Into Better Decisions
Service Level Agreements will always be essential. They set baselines, create accountability, and ensure contractual commitments are met.
But the strongest customer support organizations treat SLA compliance as their starting point. They combine SLA data with CX, quality, and operational metrics—often through BPO partnerships—to identify opportunities for improvement before they affect customers.
Centro is a business process outsourcing partner specializing in customer experience, multilingual contact center operations, quality management, and performance optimization.
We help organizations build support teams that improve customer outcomes alongside operational efficiency.
If your dashboards are green but your customers are still leaving, speak with the Centro team about building customer support operations that deliver results beyond SLA compliance.